Management > System Monitoring > Console User Guide
The console user guide provides basics of how to use System Monitoring. - Server Dashboard - User Group - Notify Group
Server Dashboard
Compute > System Monitoring > Server Dashboard allows you to view the list of instances to be monitored and the basic metric chart. If there is no server to monitor, the server list is empty. In this case, you must make sure that those instances being used under Compute > Instance are working properly or the System Monitoring Agent has been installed in the instances to be monitored and is working properly. For how to install the Agent, please see the section How to Install Agent.
If the Agent has been installed successfully and metric data are collecting through System Monitoring, the corresponding instances are listed in the server list to the left. Select an instance and view its metric data collected on the right chart.
Server List
Select a desired server from the server list to view the metric of each server. The server list displays the host name and IP of the server and status indicator which shows the monitoring status. The color of the status indicator varies according to the current monitoring status.
- Green: Normal
- Yellow: The instance information is unknown but monitoring is in progress
- Red: Monitoring has been stopped even though the instance is operating
- Dark gray: Instance which has been stopped
- Light gray: Instance deleted
Hover mouse over the status indicator to view the status value of the instance and the agent.
By default, the server instance deleted from Compute > Instance is not displayed in the server list of the server dashboard. However, the metric data is not deleted but retained. To view the metric of the deleted instance, select View Also Deleted Servers.
Default Layout
The chart layout that first shows on Compute > System Monitoring > Server Dashboard is the Default Layout. This default layout can be used without any further settings. It shows CPU Usage, Memory Usage, and Disk Usage, Network I/O Rate charts. Since 'Default Layout' is a layout provided by System Monitoring by default, user cannot configure it by himself or herself.
Create Layout
To add a new metric or make your own chart placement, you need a new layout. To create a layout, click the Create Layout button at the top of the server dashboard. Up to five layouts can be created for each project.
Enter the name in the Create Layout window and then click the Create button to create a new layout. An empty screen appears since there is no registered chart. To add a new chart, click the Add Chart button by following the on-screen guide.
Create Chart
Click the Add Chart button to display the list of selectable metrics.
On the right side, the list of metrics provided by System Monitoring is displayed. Select one metric to display it chart preview on the left side. Click the Add button to add the selected chart at the bottom of the layout.
For user-created layouts, users can adjust the position and size of the charts as desired. The user-added charts provide the following additional functions:
- Click the icon at the top right: Deletes the chart from the layout.
- Drag the icon at the bottom right: Adjusts the chart size.
- Drag the chart title: Changes the chart position.
You can select the created layout from the layout dropdown menu at the top.
Modify/Delete Layout
Click the Manage button to change the name of layouts or delete unnecessary layouts.
Select Date
metric data collected is retained for up to five years. Click the Calendar button at the top right to set the lookup range.
In the Time Range window, select the start date (From) and the end date (To) of the lookup range. You can select the start and end date in two ways. First, you can select the date directly. Click From and To to display the date selection window. In the date selection window, you can specify the date directly.
Second, you can use a hotkey. Below each date button, there are separately placed buttons: Now, 1 Hr, 1 Day, etc. Click the desired button to specify the period. If you click a hotkey, just below the hotkey, you will be asked from which period data should be taken.(e.g. Search data from 7 Days ago to Now.)
Aside from the date selection window, there is another way of selecting the date range. You can directly select a lookup period yourself on the chart. Drag a desired period horizontally within the chart to select a dragged area and you can view the data of the selected period. You can select and focus on the section that shows an abnormal shape in the chart.
User Group
Compute > System Monitoring > User Group allows you to specify which of his monitored users will receive notifications when a specific event occurs. You can select members among project members and group users to different groups for easy management.
If there is no user group, an empty screen will appear when you look up the user group for the first time. To receive notification from System Monitoring, add a user group as guided on the screen.
Create User Group
To create a user group, go to Compute > System Monitoring > User Group and then click the Create Group button.
Enter the name in the Create Group window and then click the Create button to create a new user group. And you are automatically moved to the next step to add project members to the user group.
The list of users who belong to the current project is displayed at the bottom of the Edit User Group window. Click the Add button next to each user name in the user list to add users to the user group. You can set to send a notification to the users in the user group from the Notify Group to be linked later.
After creating the user group, you can look up the user group list from Compute > System Monitoring > User Group.
Modify User Group
To modify the created user group, click the Edit button from the user list group. Click the Edit button to display the Edit User Group window. In the same way you created a user group, you can modify the members of your user group.
To modify the user group name, click the pencil icon on the right side of the user group name.
Notify Group
You can manage the Notify Group at Compute > System Monitoring > Notify Group. Tow roles of the Notify Group are as follows: - Sets the threshold to each system metric. In System Monitoring, monitoring setting refers to setting threshold to the system metric. When the selected system metric reaches the threshold, a notification is sent to the specified user group. - You can link the created monitoring setting with the monitoring target server and then link with the user group to receive the notification. Actually, the Notify Group plays a role in connecting the server dashboard and user group.
If there is no Notify Group, an empty screen appears when you look up the Notify Group for the first time. To set a threshold to the system metric and send a notification to the desired user group, add a Notify Group following the on-screen guidance.
Create Notify Group
Click the Create Group button to create a new Notify Group.
Enter the group name in the Create Group window and then click the Create button to add a Notify Group.
Register/Modify/Delete Monitoring Setting
To register monitoring setting, click the Setting button on the left side of the Notify Group buttons. If no monitoring setting has been registered, nothing will be displayed. To add a new monitoring setting, click the Add Monitoring Setting button. A new input field for monitoring setting will be added but it doesn't save any monitoring setting for now. Specify a threshold to the desired system metric and then click the Save button to save the monitoring setting. Click the Cancel button to remove the input field.
The saved monitoring setting can be modified by clicking the pencil icon on the right side. It can also be deleted by clicking the trash bin icon.
The following is the list of system metrics to which monitoring can be set.
| Item | Unit | Comparison type | Additionally requested value |
|---|---|---|---|
| Server: Reboot | Reboot | - | - |
| CPU: Used | % | Higher/Lower | - |
| CPU: Idle | % | Higher/Lower | - |
| CPU: User | % | Higher/Lower | - |
| CPU: System | % | Higher/Lower | - |
| CPU: nice | % | Higher/Lower | - |
| CPU: irq | % | Higher/Lower | - |
| CPU: softirq | % | Higher/Lower | - |
| CPU: iowait | % | Higher/Lower | - |
| Load Average: 1 Min | - | Higher/Lower | - |
| Load Average: 5 Min | - | Higher/Lower | - |
| Load Average: 15 Min | - | Higher/Lower | - |
| Memory: Used | % | Higher/Lower | - |
| Memory: Used | MB | Higher/Lower | - |
| Memory: Free | MB | Higher/Lower | - |
| Memory: Buffers | MB | Higher/Lower | - |
| Memory: Cached | MB | Higher/Lower | - |
| Memory: pgpgin | KB/s | Higher/Lower | - |
| Memory: pgpgout | KB/s | Higher/Lower | - |
| Swap: Used | % | Higher/Lower | - |
| Swap: Total | MB | Higher/Lower | - |
| Swap: Used | MB | Higher/Lower | - |
| Disk: Read | Counts | Higher/Lower | - |
| Disk: Write | Counts | Higher/Lower | - |
| Disk: Read | Bytes | Higher/Lower | - |
| Disk: Write | Bytes | Higher/Lower | - |
| File System: Used | MB | Higher/Lower | Partition name |
| File System: Avail | MB | Higher/Lower | Partition name |
| File System: Used | % | Higher/Lower | Partition name |
| File System: i-node Used | % | Higher/Lower | Partition name |
| File System: Mount | - | Included/Not included | - |
| NIC: Recv | Bytes/s | Higher/Lower | Interface name |
| NIC: Send | Bytes/s | Higher/Lower | Interface name |
| NIC: Recv Packets | pps | Higher/Lower | Interface name |
| NIC: Send Packets | pps | Higher/Lower | Interface name |
| NIC: Recv Error | Counts | Higher/Lower | Interface name |
| NIC: Send Error | Counts | Higher/Lower | Interface name |
| NIC: Collision | Counts | Higher/Lower | Interface name |
| User: User Count | - | Higher/Lower | Interface name |
| Process: Total Count | - | Higher/Lower | - |
| Process: Down | - | - | - |
| Process: Count | - | Higher/Lower | Process name |
| Process: CPU | % | Higher/Lower | Process name |
| Process: Memory | % | Higher/Lower | Process name |
| Process: Memory | KB | Higher/Lower | Process name |
| Process: Thread Count | - | Higher/Lower | Process name |
| Process: Restart | - | - | Process name |
| File: Content | TEXT | Included/Not included | File Path |
| File: Size | KB | Higher/Lower | File Path |
| File: Modification | - | - | File Path |
| File: Non-Modification | - | - | File Path |
| File: Non-Exist | - | - | File Path |
Each monitored item has a unique value unit. Depending on the item, an additional value may be required except the threshold.
Monitoring Setting Duration
Duration of monitoring setting is an important element. Duration is used to specify the period for which the state is maintained after the monitoring target reaches a specific threshold. For example, when the threshold of CPU usage is 90% or higher and the duration is 5 minutes, a notification will be sent to users defined in the group when the CPU usage of the server linked with the corresponding Notify Group has been 90% or higher for over 5 minutes. Even if the CPU usage is 90% or higher, no notification will be sent if the usage goes below 90% within 5 minutes.
Set the Monitoring Target and Notification Target
Connect the monitoring target server to apply the monitoring setting defined above to the user group which will receive a notification when the monitoring conditions are met. Click the Server - User Integration button on the right side of the Setting button.
At the top, specify the server to apply the monitoring setting specified in the corresponding Notify Group. At the bottom, specify the user group which will receive a notification when the monitoring conditions are met. To deselect, click the X button on the right side of the server or user group name or select again from the dropdown menu to deselect.
Now you can look up the Notify Group list from Compute > System Monitoring > Notify Group.
Monthly Metrics Report
You can find monthly metrics reports from Compute > System Monitoring > Monthly Metrics Report.
GENERAL Report Type
- Monthly metrics report is created based on Server Dashboard.
- You can select one or more metrics among Average CPU, Maximum CPU, Average Memory, Maximum Memory, Outbound Network, Inbound Network, and File System Usage.
- You can select one of 5m, 30m, 2h, and 1D, and the value of Month you can select depends on the selected interval (You can select up to 6 months in advance).
- Click Request Download to request report creation. The created list can be found in Report Generation Request Status.
- Report generation is asynchronous and cannot be downloaded until generation is complete.
PROMQL Report Type
- Monthly metrics report is created based on OpenMetrics Dashboard.
- Metrics use PROMQL queries, the same one used by the charts in the OpenMetrics Dashboard, detailed examples can be found https://prometheus.io/docs/prometheus/latest/querying/basics/.
- You can select one of 5m, 30m, 2h, and 1D, and the value of Month you can select depends on the selected interval (You can select up to 6 months in advance).
- Click Request Download to request report creation. The created list can be found in Report Generation Request Status.
- Report generation is asynchronous and cannot be downloaded until generation is complete.
How to Install Agents
Linux
- Requires Root Authority
-
Check if Installation Script Exists within Instance
- See if there is a script file in the path like below:
/opt/toast-sysmon-install.sh
- See if there is a script file in the path like below:
-
Download Installation Script
- If there is no file from no.2, download one from the following link: https://static.toastoven.net/toastcloud/sdk_download/monitoring/toast-sysmon-install.sh
-
Execute Installation Script on Server
- With installation script executed and installed on the server, monitoring shall begin automatically.
Windows
- Requires Administrator Authority
-
Check if Installation Script Exists within Instance
- See if there is a script file in the path like below:
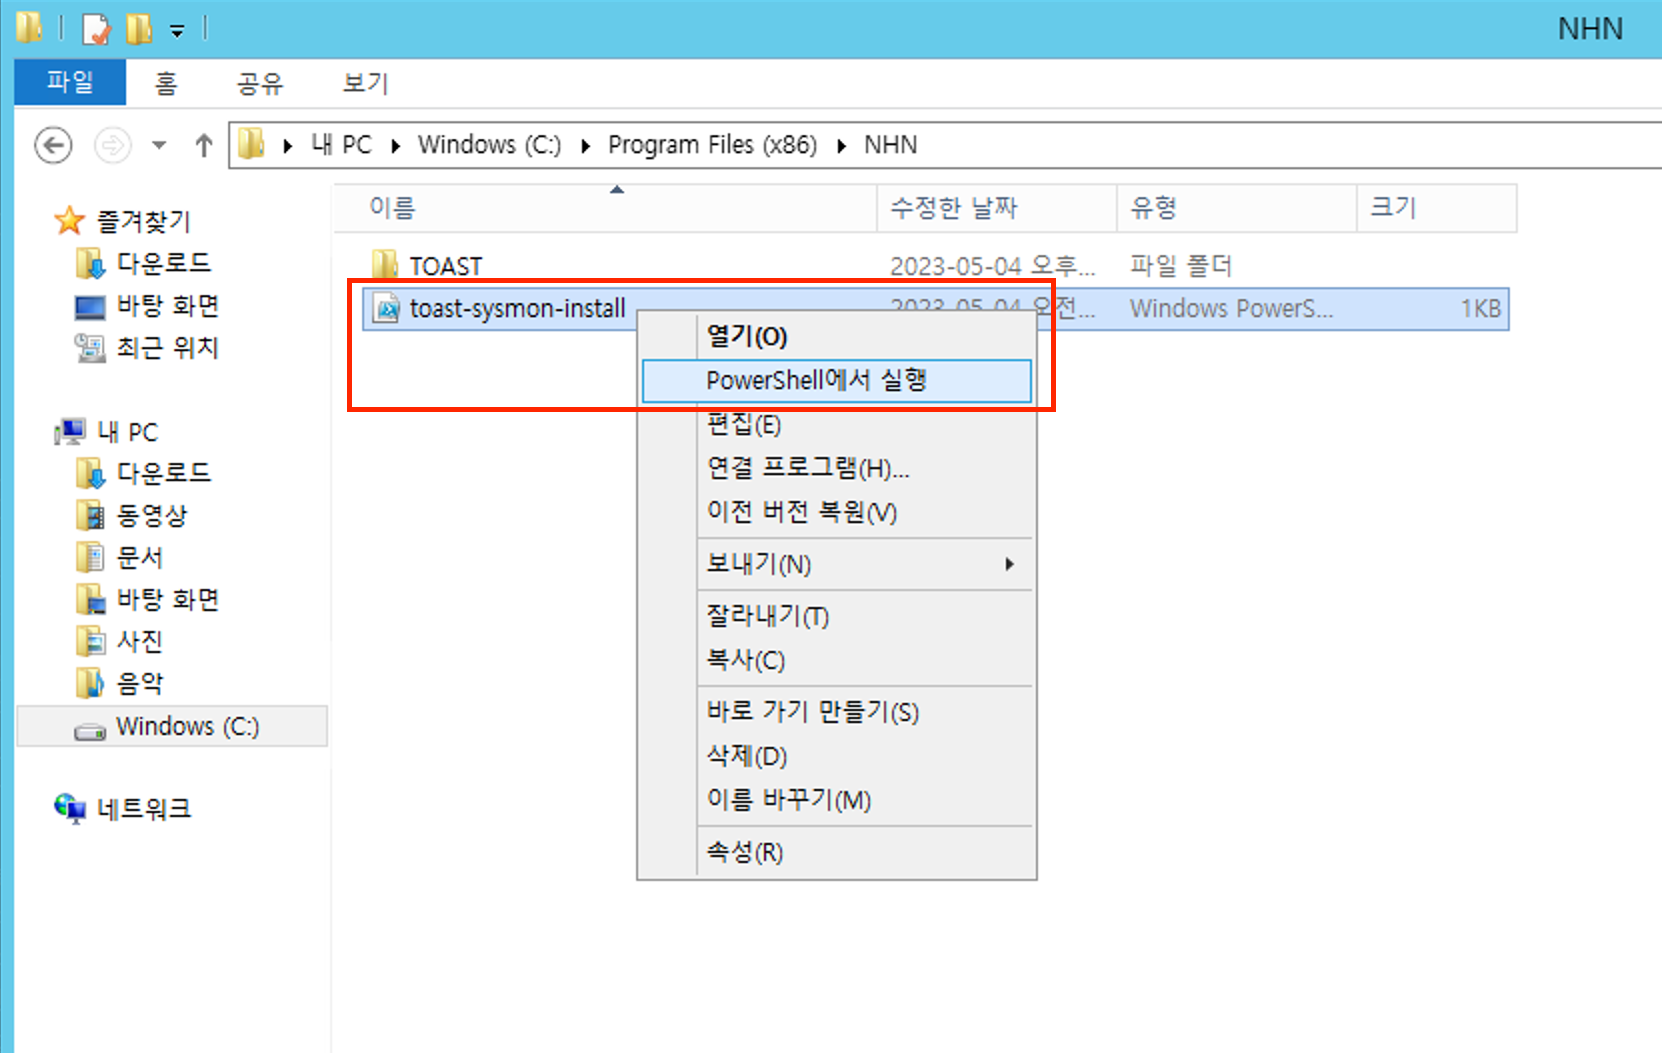
C:\Program Files(x86)\NHN\toast-sysmon-install.ps1
- See if there is a script file in the path like below:
-
Download Installation Script
- If there is no file from no.2, download one from the following link: https://static.toastoven.net/toastcloud/sdk_download/monitoring/toast-sysmon-install.ps1
-
If you right-click the
toast-sysmon-install.ps1file to select Run in PowerShell, the installation starts from scratch and the file is registered as a Windows service. - Monitoring starts automatically after installation is complete.
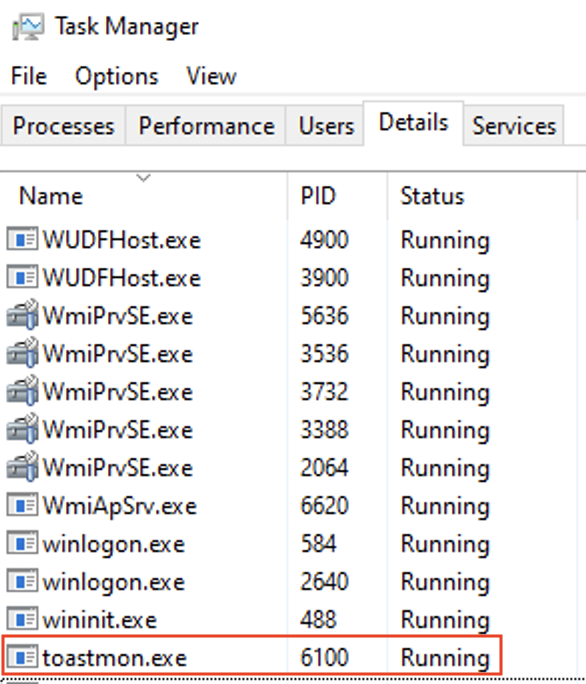
Check Windows Agent Operation
- Check that the Agent is running in Windows Task Manager.
- Check that the
toastmon.exefile is running in theDetailstab of Windows Task Manager.
Reinstall Windows Agent
* To reinstall Windows Agent, delete and reinstall the already installed Agent.
Delete Windows Agent
- Agent-related files are located in C:\Program Files (x86)\NHN\TOAST.
Table of Contents
- Management > System Monitoring > Console User Guide
- Server Dashboard
- Server List
- Default Layout
- Create Layout
- Create Chart
- Modify/Delete Layout
- Select Date
- User Group
- Create User Group
- Modify User Group
- Notify Group
- Create Notify Group
- Register/Modify/Delete Monitoring Setting
- Set the Monitoring Target and Notification Target
- Monthly Metrics Report
- GENERAL Report Type
- PROMQL Report Type
- How to Install Agents
- Linux
- Windows